

Featured Reporting
In Washington State, Prison Closure Divides Abolitionist Community
When the Washington State DOC announced it would close the Washington State Reformatory, it caused a rift between incarcerated abolitionists.
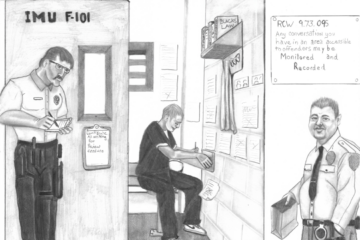
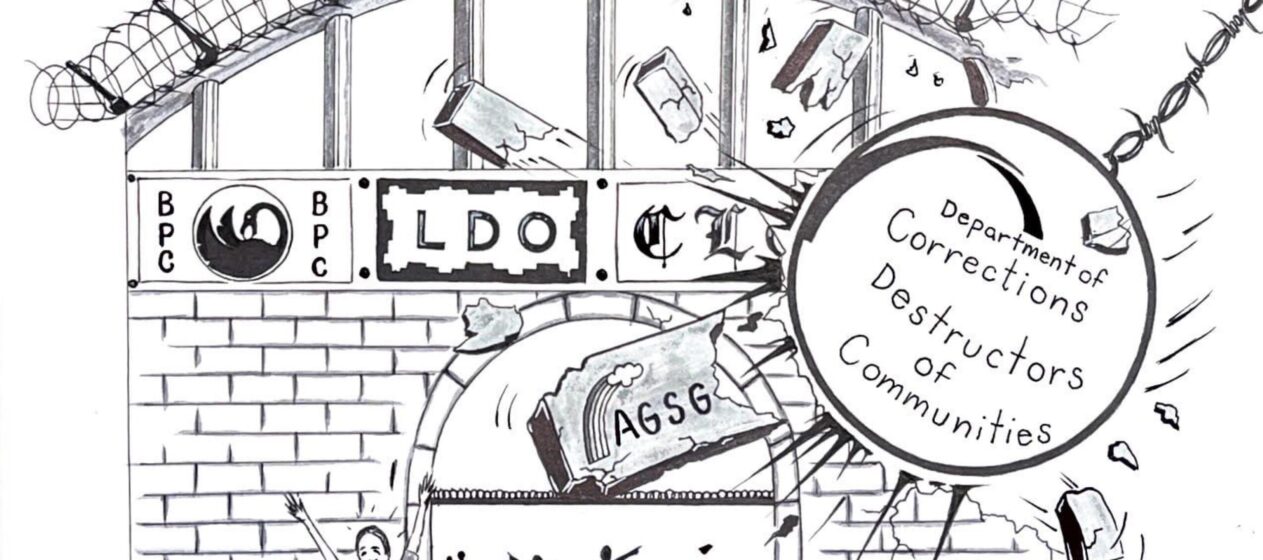
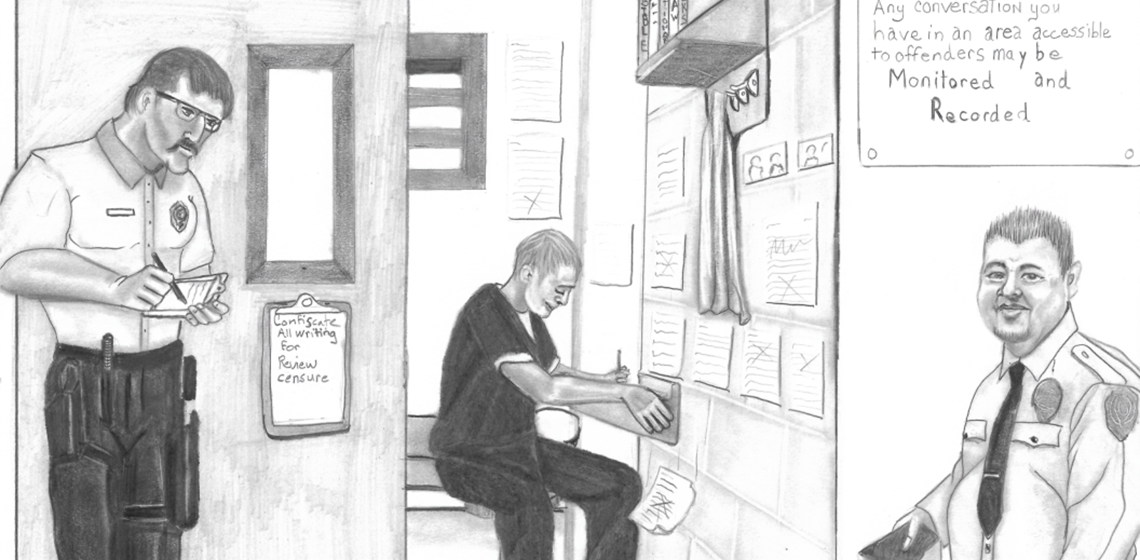
From Behind Enemy Lines, Prison Journalists Report On Conditions At Their Own Risk
Practicing journalism in prison is necessary, but incarcerated reporters face enormous risks and aggressive retaliation.
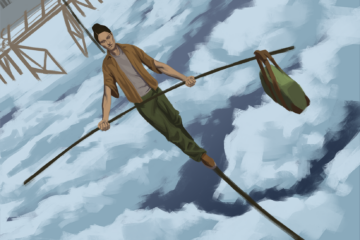
Rebuilding A Life After Years In A Cage
Rebuilding a life after years in a cage is a daunting task and some of those challenges are quantified and documented. But there are many more complicated, nuanced challenges that are less popularly known and harder to turn into data.

Redacted: Massachusetts Withholding Plans For New Women’s Prison
Massachusetts is refusing to share information about plans for a new women’s prison with concerned citizens through a controversial exemption to the state’s public records law.
In The South, ‘Georgia Prisoners Speak’ Organizes Against Incarceration From The Inside
Inside Georgia’s prisons, Georgia Prisoners Speak fights barriers to the outside and engages in abolitionist political education.
Interview: Returning To General Population After San Quentin Closes Death Row
Jovan Strong speaks to Steven Anthony Jones about adjusting to life after Death Row.